Modius Data Center Blog

Illuminating DCIM tools: Asset Management vs. Real-time Monitoring

Posted by Donald Klein on Wed, Dec 15, 2010 @ 11:26 AM

Gartner DCIM ModiusIn the news recently, there has been a lot of discussion around a new category of software tools focusing on unified facilities and IT management in the data center.  These tools have been labeled by Gartner as Data Center Infrastructure Management (DCIM), of which Modius OpenData is a leading example (according to Gartner).

In reality, there are multiple types of tools in this category - Asset Management systems and Real-time Monitoring systems like Modius.  The easiest way to understand the differences is to reflect on two key elements: 

  • How the tools get the data?
  • And how time critical is the data?

Generally speaking, data center Asset Management systems, like nlyte, Vista, Asset-Point, Alphapoint, etc., are all reliant on 3rd party sources to either facilitate data entry of IT device 'face plate' specs, or are fed collected data for post process integration. 

The data processing part is what these systems do very effectively, in that they can build a virtual model of the data center and can often predict what will happen to the model based on equipment 'move, add or change' (MAC). These products are also strong at utilizing that model to build capacity plans for physical infrastructure, specifically power, cooling, space, ports, and weight. 

To ensure that the data used is as reliable as possible the higher priced systems contain full work-flow and ticketing engines. The theory being that by putting in repeatable processes and adhering to them, the MAC will be entered correctly in the system. To this day, I have not seen a single deployed system that is 100% accurate.  But for the purposes they are designed for (capacity and change management), these systems work quite well.

Real time accurate dataHowever, these systems are typically not used for real-time alarm processing and notification as they are not, 1) Real-time, and 2) Always accurate.

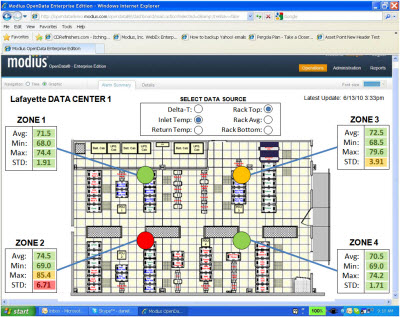
Modius takes a different approach.  As compared with Asset Management tools, Modius gets its data DIRECTLY from the source (i.e. the device) by communicating in its native protocol (like Modbus, BACnet, and SNMP) versus theoretical 'face plate' data from 3rd party sources.  The frequency of data collection can vary from 1 poll per minute, to 4 times a minute (standard), all the way down to the ½ second.  This data is then collected, correlated, alarmed, stored and can be reported over minutes, hours, days, weeks, months or years. The main outputs of this data are twofold:

  • Modius AlarmsCentralized alarm management across all categories of equipment (power, cooling, environmental sensors, IT devices, etc.)
  • Correlated performance measurement and reporting across various catagories (e.g. rack, row, zone, site, business unit, etc.)

Modius has pioneered real-time, multi-protocol data collection because the system has to be accurate 100% of the time.  Any issue in data center infrastructure performance could lead to a failure that could affect the entire infrastructure.  This data is also essential in optimizing the infrastructure in order to lower cooling costs, increase capacity, and better management equipment.

Both types of tools -- Asset Management tools and Real-time Monitoring systems -- possess high value to data center operators utilizing different capabilities.  The Asset tools are great for planning, documenting, and determining the impacts of changes in the data center.  Modius real-time monitoring interrogates the critical infrastructure to make sure systems are operating correctly, within environmental tolerances, and established redundancies.  Both are complimentary tools in maintaining optimal data center performance.

Because of this inherent synergy, Modius actively integrates with as many Asset Management tools as possible, and supports a robust web services interface for bi-directional data integration. To find out more, please feel free to contact Modius directly at info@modius.com.

Topics: Data-Collection-and-Analysis, data center capacity, data center operations, real-time metrics, Data-Collection-Processing, data center infrastructure, IT Asset Management

What You Really, Really Need: The Mother of all Data Center Monitors!

Posted by Donald Klein on Tue, Aug 31, 2010 @ 11:26 AM

You may have asked yourself, “Why do I need another monitoring and reporting product if I already have five?”  True, you most likely don’t need another monitoring product, but rather what you really, really need is a system to link these systems together. 

Why?  Because several different monitoring systems operating in their own silos doesn’t help you improve your business.  Instead, what you need to do is build business logic for optimization and capacity expansion strategies, as well as decrease the time spent to repair problems. 

To do this effectively, you need a super system: what we call the “mother of all monitors”.  This is a system that cannot only collect a superset of monitoring data from different point solutions, but also connect directly to other devices that may not currently be monitored (e.g. generators, transfer switches, breaker panels, etc.).  And it needs to do this with the kind of scalability, analytics, and ability to integrate with other management systems that you would expect from an enterprise-class tool. 

Here at Modius, we are already seeing this happen in the field.  There is a current trend among data center managers to link their monitoring platforms together so that they have one common central platform to view and navigate to distributed monitoring systems.  We have designed our application, OpenData, with a  “Monitor of Monitors” architecture in order to provide operators with a single pain of glass into both the facilities infrastructure including power-chain, cooling, and redundancies as well as IT system level information.

MOM2

The key problems solved are:

  1.  System-level metrics - Link system level IT metrics to facilities capacities  
  2.  Trouble shooting - Accelerate trouble shooting and fault dependency mapping
  3. Alarm management - Reduction in “noise-level” alarms
  4. Analytics - Building business-level metrics (BI) for capacity, efficiency, etc.
  5. Controls-based integrations – Improved automation based on broad data capture

Here is some more detail on each of these benefit areas …

1)      System-level metrics

Typically, IT system-level metrics are collected by system management tools and will provide logical properties based on MIB-2 or the Host MIB (RFC-1514).  This provides IT managers with data on the operating health of the equipment and capacity related to CPU, Disc, I/O, Memory.  What management systems typically do not provide, however, is how facilities (power, cooling, etc.) impacts the cost of operations and the amount of optimal cooling. 

By linking IT system-level metrics with unified facilities monitoring through a single portal, higher level business and operating metrics can be formulated to reduce the cost of operations by tuning available cooling resources to the actual needs of each server instance or other IT gear.

2)      Trouble shooting

By consolidating event and performance data into a single view, you can quickly determine the cascade of failures with the visibility to determine the impacts of facility equipment.  An example could be a PDU failure and what devices are in the path of the affected circuit.  In redundant environments there will be a fail-over to the second PDU but in most cases the assurances of a successful hand-off are difficult to predict.  By linking both facilities BMS, PDU’s, UPS, Genset with system level IT information the relationships are documented, visualized, correlated and actively monitored.

3)      Reduction in rogue alarms

By linking point solutions and consolidated even level data, a complete historical view may be achieved.  Through this historical view, alarm flows can be optimized and reduced operationally.  An example would be a BMS received alarms at a rate where the alarms become noise as they are not easily tuned.  Also contextually, it is very difficult to look at what a typical operating condition is as there is not enough or broad enough history to proactively set truly meaningful thresholds or deviations.

4)      BI-based business metrics

With a single point of consolidation, you can quickly build reports and dashboards across platforms.  An example would be a stock chart type view when you can visualize a period of time.  This is used to determine deviations from the norm which might cause downtime or affect operational performance.  With several independent systems it becomes impossible to correlate based on time or carry enough history to gain the insight necessary to prevent a potential outage.

5)      Single application launch point

The “Monitor of Monitor” architecture brings a unified structure to gain access to operational and control systems.  An example use case would be to identify cooling requirements based on broad-based data capture (e.g. an array of environmental sensors at the rack level, or real-time server-inlet temperatures taken directly from servers themselves) and then tie the resulting performance metrics into building control systems to tune VFD’s and cooling output.  Integrating the BMS application directly to the monitoring system allows the use the real-time data required and feedback mechanism to optimize cooling and cost without overheating the IT equipment.

Conclusion

If you would like more detail on how Modius can help with any the above topic areas, please reach out directly using info@modius.com, and we will be happy to set up an appointment.

Topics: data center monitoring, Data-Collection-and-Analysis, Data Center Metrics, Data Center PUE, data center energy monitoring, real-time metrics, Data-Collection-Processing, data center alarming

Data Center Management must include continuous real-time monitoring.

Posted by Mark Harris on Fri, Jun 25, 2010 @ 09:40 AM

I spend a great deal of time talking about data center efficiency and the technologies available to assist in driving efficiency up. Additionally a great deal of my time is spent discussing how to determine success in the process(es). What I find is that there is still a fundamental missing appreciation for the need for 'continuous' real-time monitoring to measure success using industry norms such as PUE, DCIE, TCE and SWaP. I can't tell you how many times someone will tell me that their PUE is a given value, and look at me oddly when I ask 'WHEN was that?'. It would be like me saying 'I remember that I was hungry sometime this year'. The first response would clearly be 'WHEN was that?'

food

Most best practice guidelines and organizations involved here, (such as The Green Grid, and ITIL) are very clear that the improvement process must be continuous, and therefore the monitoring in support of that goal must also be. PUE for instance WILL vary from moment to moment based upon time of day and day of year. It is greatly affected by IT loads AND the weather for example. PUE therefore needs to be a running figure, and ideally monitored regularly enough that the Business IT folks can detremine trending and other impacts of new business applications, infrastructure investments, and operational changes as they affect the bottom line.

Monitoring technologies should be deployed that are installed permanently. In general, 'more is better' for data center monitoring. The more meters, values, sensors and instrumentation you can find and monitor, the more likely you'll have the raw information needed to analyze the data center's performance. Remember, PUE is just ONE KPI that has enough backing to be considered an indicator of success or progress. There surely will be many other KPIs determined internally which will require various sets of raw data points. More *IS* better!

We all get hungry every 4 hours, why would we monitor our precious data centers any less often?

Topics: Data Center PUE, data center management, real-time metrics

Latest Modius Posts

Posts by category

Subscribe via E-mail