Modius Data Center Blog

Data Center Analysis, Monitoring may not always be the first step...

Posted by Mark Harris on Fri, May 28, 2010 @ 02:54 PM

While I've seen my share of some pristine new data centers over the past few years, as well as a huge number of large scale retro-fit projects where old centers are being turned into new usable data center space, I have also seen an alarming number of older 'house of cards' data centers that are up in modern production and appear to be 'hands-off'.

These data centers are typically chock full of older devices and interconnects that were passed down from generation to generation of IT managers, only to realize that what they inherited was unmanageable. While it is true that these data centers will ultimately find their way into extinction in a world focused on operational efficiency and pro-active management and best practices, we can all feel the pain involved when we encounter something like this.

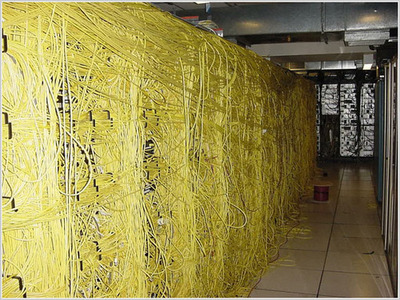
Above is one of the most interesting centers I've seen, and would appear to have conflicting priorities as to what is required to move forward. While I don't have a comprehensive sequence of steps required to migrate to a highly supportable, efficient and monitored data center, let me suggest one step that will help tremendously... Find the YELLOW patch cord and disconnect it.

Seriously, when I saw this photo I had to laugh and take a second look. Was it some new thermal blanketing technology? Or a way to eliminate blanking panels? The reason I make light here is that there are countless data centers that are in similiar out-of-spec designs and would benefit from adopting new data center technologies, new power distribution, cooling and monitoring solutions, but are challenged by WHERE TO BEGIN and the magnitude of the task at hand.

In the monitoring world for instance where Modius delivers value, we regularly find data centers with NO VISIBILITY to their energy usage and easily can identify hundreds or thousands of points of monitorable data that would help get energy usage under control. We are ready willing and able to take on chaos and make sense of it.

Topics: Energy Efficiency, data center analysis, data center management, real-time metrics, data center temperature sensors, data center infrastructure

Visual Asset Management - How about some Real-Time metrics with that?

Posted by Mark Harris on Sun, Apr 04, 2010 @ 05:13 AM

The granular management of all assets being placed or moved within a datacenter has become highly desirable over the past several years. Important to note is that most major companies will claim to already solved the asset management needs with an array of typically disconnected and many times complex sets of tabular asset manager products. These same companies are now quietly looking for 'something else' to help get them to where they 'really' need to be... 

The newest generation of asset management suites are focused on visually representing assets with a drag-and-drop approach to adds, moves and changes. These new lifecycle management suites allow equipment to be added, moved or changed in existing facilities in a highly predictable and efficient manner. Examples of these modern suites include Aperture, Altima/Netzoom, Rackwise, nLyte, Avocent, ShowRack, APC, VisualDatacenter, Raritan/dcTrack, FieldView and a handful of others. Each of these management software suites has been crafted to allow complex data centers to be visually articulated with a high degree of fidelity, identifying everything from the manufacturer, model and serial number, to the purchase date, PO number, owner’s name and physical location.

In typical scenario, the user will graphically navigate using a drill-down tool which mimics the ‘Google Earth’ model… starting with very macro views and then selectively drilling-down to progressively more detailed views of smaller areas. In each view, various operational metrics are constantly reported such as ‘power being consumed’ within the current view. Ultimately single discrete values can be displayed.

Historically, these suites have relied on ‘faceplate’ information. This faceplate information is based upon the manufacturer’s published specification for a specific given device. It is usually the maximum value. A 1U web server for instance may have a published faceplate power consumption of 450 Watts, but the actual power draw in normal operation may be a much lower 150Watts or less.  This discrepancy creates the potential for huge errors and inefficiencies when planning for overall capacity and expansion opportunities.

Consequently, one of the newest customer requirements needing to be addressed by EACH of the asset management suite vendors is to add real-time metric data. The desired metric data will obviously include the value for Power consumption, but may also include less intuitive values for fans speeds, inlet and CPU temperature, CPU and RAM utilization, available disk space, etc.  While these values are relatively easy to come by as an individual user of each system, many different technologies must be exercised to programmatically and remotely retrieve these values in real-time.

This is currently where many of the latest generation of visual Asset Managers struggle. While their systems are amazing at handling the visual manipulation of IT assets, moving racks and routers along floorplans and data centers, the systems are simply not built with a large enterprise in mind when it comes to gathering Real-Time metric data. Gathering metric data for 12 servers at a trade-show is very appealing, but doing the same type of metric gathering in production against 12,000 or 112,000 servers is a bigger fish to fry. To do so requires a distributed collection architecture that is purpose built to collect any and all data from any device which is network addressable.

Real-Time monitoring with OpenData is the technology that will support the replacement of these faceplate ‘theoretical’ values with actual observed values… allowing a significantly more accurate view for planning purposes. Modius' OpenData(r) is built on a fully distributed bus architecture, is firewall friendly, and can be deployed easily to provide any asset management tool's need for Real-Time monitoring. OpenData  SUPPORTS rather than replaces Asset Management suites, and has been crafted with API's and Web Services interfaces to allow the OpenData gathered metric data to be CONSUMED by any number of other applications, including the current crop of Visual Asset Managements solutions. The combination of a best-of-breed visual asset management tool with a highly granular metric monitoring solution like Modius OpenData allows business costs to be much more understood and ultimately will allow existing data centers to provide significantly more capacity and increases the lifespan of the data center itself.

Topics: data center monitoring, real-time metrics, Measurements-Metrics, IT Asset Management

Latest Modius Posts

Posts by category

Subscribe via E-mail