How to achieve better visibility and control over your data center operations—without the risk.
Veterans of data center operations tell us that having visibility and gaining better control over the critical infrastructure and IT assets throughout their entire facility is the key to maximizing data center efficiency.
Achieving this requisite visibility is not a trivial task. It involves overcoming the interoperability hurdles of monitoring all of the various critical systems—such as generators, chillers, water pumps, air exchangers, PDUs, power strips, on-board server instrumentation, and more.
 On top of that, making sense of the various alarm schemas—which are so vital to maintaining control of data center performance and achieving a higher level of efficiency—can be more of a headache than the alarm system is worth. They typically don’t factor input from the full gamut of facility and IT equipment into their respective alarm thresholds. Consequently, spurious alerts from the disparate alarm systems trip over themselves and conceal the true state of the data center.
If your work is impeded by spurious alarms…or if you find yourself ignoring low-level alarms because they’re out of context from your overarching data center priorities…or if you cringe at the thought of the time and cost involved in deploying a monitoring and alarm management solution across your entire data center, then Modius can help.
 Modius offers OpenData Standard Edition, a low-cost unified alarm management and notification solution for monitoring all power and cooling equipment, including IT racks. At only $1,995 per user per year, it is the only solution in the industry offered at a very low cost and distributed as a downloadable, easy-to-install software package. This low-cost offering reduces the risk of “locking in” to a solution without having it thoroughly tested in your environment, on your own terms.
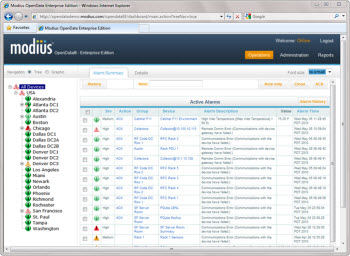
OpenData interoperates with most network equipment through its support of the essential communications protocols, including SNMP, Modbus and BACnet. It collects and stores performance data, normalizes it, then transforms the data into a simplified, federated view. This means you don’t have to kludge together various point solutions, or contend with different data formats or increments that add complexity to data center management.
And, because of OpenData’s intelligent monitoring capabilities, customers also benefit from a sensible, unified approach to alarm management. The OpenData software matches all monitored performance against configurable thresholds and sends out alarms via a centralized notification engine. Rather than send an overflow of low-level alerts, it only sends the alarms you need when they matter most. This means you can manage your data center as a complete system—instead of disparate components—and get insight to the true state of your data center.
Sign up for a free demo of OpenData Standard Edition today and uncover the true state of your data center in a matter of hours.
