There has been plenty of discussion of PUE and related efficiency/effectiveness metrics of late (Modius PUE Blog posts: 1, 2, 3). How to measure them, where to measure, when to measure, and how to indicate which variation was utilized. Improved efficiency can reduce both energy costs and the environmental impact of a data center. Both are excellent goals, but it seems to me that the most common driver for improving efficiency is a capacity problem. Efficiency initiatives are often started, or certainly accelerated, when a facility is approaching its power and/or cooling limits, and the organization is facing a capital expenditure to expand capacity.
When managing a multi-site enterprise, understanding the interaction between capacity and efficiency becomes even more important. Which sites are operating most efficiently? Which sites are nearing capacity? Which sites are candidates for decommissioning, efficiency efforts, or capital expansion?
For now, I will gracefully skip past the thorny questions about efficiency metrics that are comparable across sites. Let’s postulate for a moment that a reasonable solution has been achieved. How do I take advantage of it and utilize it to make management decisions?
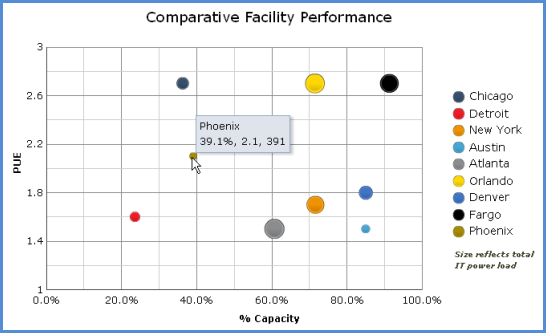
Consider looking at your enterprise sites on a “bubble chart,” as in Figure 1. A bubble chart enables visualization of three numeric parameters in a single plot. In this case, the X axis shows utilized capacity. The Y axis shows PUE. The size of each bubble reflects the total IT power load.
Before going into the gory details of the metrics being plotted, just consider in general what this plot tells us about the sites. We can see immediately that three sites are above 80% capacity. Of the three, the Fargo site is clearly the largest, and is operating the most inefficiently. That would be the clear choice for initiating an efficiency program, ahead of even the less-efficient sites at Chicago and Orlando, which are not yet pushing their capacity limits. One might also consider shifting some of the IT load, if possible, to a site with lower PUE and lower utilized capacity, such as Detroit.
In this example, I could have chosen to plot DCiE (Data Center Infrastructure Efficiency) vs. available capacity, rather than the complementary metrics PUE vs. utilized capacity. This simply changes the “bad” quadrant from upper right to lower left. Mainly an individual choice.
Efficiency is also generally well-bounded as a numeric parameter, between 0 and 100, while PUE can become arbitrarily large. (Yes, I’m ignoring the theoretical possibility of nominal PUE less than 1 with local renewable generation. Which is more likely in the near future, a solar data center with a DCiE of 200% or a start-up site with a PUE of 20?) Nonetheless, PUE appears to be the metric of choice these days, and it works great for this purpose.
Whenever presenting capacity as a single number for a given site, one should always present the most-constrained resource. When efficiency is measured by PUE or a similar power-related metric, then capacity should express either the utilized power or cooling capacity, whichever is greater. In a system with redundancy, be sure to that into account.
The size of the bubble can, of course, also be modified to reflect total power, power cost, carbon footprint, or whatever other metric is helpful in evaluating the importance of each site and the impact of changes.
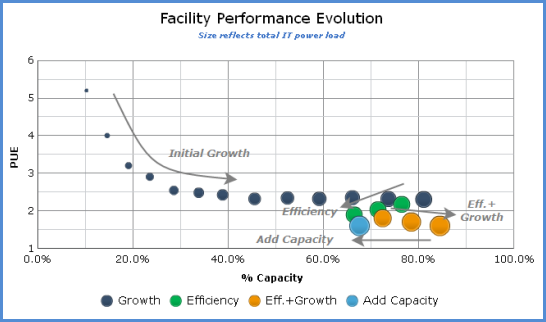
This visualization isn’t limited to comparing across sites. Rooms or zones within a large data center could also be compared, using a variant of the “partial” PUE (pPUE) metrics suggested by the Green Grid. It can also be used to track and understand the evolution of a single site, as shown in Figure 2.
This plot shows an idealized data-center evolution as would be presented on the site-performance bubble chart. New sites begin with a small IT load, low utilized capacity, and a high PUE. As the data center grows, efficiency improves, but eventually it reaches a limit of some kind. Initiating efficiency efforts will regain capacity, moving the bubble down and left. This leaves room for continued growth, hopefully in concert with continuous efficiency improvements.
Finally, when efficiency efforts are no longer providing benefit, capital expenditure is required at add capacity, pushing the bubble back to the left.
Those of you who took Astronomy 101 might view Figure 2 as almost a Hertzsprung-Russell diagram for data centers!
Whether tracking the evolution of a single data center, or evaluating the status of all data centers across the enterprise, the Data Center Performance bubble chart can help understand and manage the interplay between efficiency and capacity.
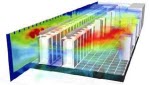 Computational Fluid Dynamic (CFD) software provides modeling of data center airflow and quick identification of hot spots. A CFD system’s three-dimensional, multi-colored thermal maps are downright sexy, and, if you’ll pardon the pun, extremely cool. When changes are made to the data center intentionally, CFD analysis can be repeated to detect the introduction of new thermal problems. So far, so good.
 But what happens when the data center changes unintentionally? Today, CFD users require real-time thermal imaging of hot spots that could result from contingencies like equipment failure, blockage or cabinet overloading. Furthermore, users want more than just problem visualization – they want recommendations for problem mitigation. They want a CFD model with some muscle – in effect, a CFD on steroids.
 The next level of growth in temperature control is temperature-based reaction. Data Center operators are now looking not only at identification but also action automation through demand-driven cooling directly to the cabinet. By leveraging Variable Frequency Drives (VFD) in cooling units, remote commands can adjust cooling at the point of demand. This can reduce power costs substantially and can prevent a cabinet meltdown. Automated actions can be taken with the existing Building Management System (BMS) without having to rip out and replace the entire system. Integration of CFD can make the BMS smarter - processing and synthesizing a vast array of data, encoding commands in building-management language, and passing reliable information to the appropriate destination so that the secure communication infrastructure can be fully maintained. Modius OpenData is currently being leveraged by customers to pump up their BMS, leverage the current infrastructure, prevent cooling related outages, and save money in power-related cooling.