You may have asked yourself, “Why do I need another monitoring and reporting product if I already have five?” True, you most likely don’t need another monitoring product, but rather what you really, really need is a system to link these systems together.
Why? Because several different monitoring systems operating in their own silos doesn’t help you improve your business. Instead, what you need to do is build business logic for optimization and capacity expansion strategies, as well as decrease the time spent to repair problems.
To do this effectively, you need a super system: what we call the “mother of all monitors”. This is a system that cannot only collect a superset of monitoring data from different point solutions, but also connect directly to other devices that may not currently be monitored (e.g. generators, transfer switches, breaker panels, etc.). And it needs to do this with the kind of scalability, analytics, and ability to integrate with other management systems that you would expect from an enterprise-class tool.
Here at Modius, we are already seeing this happen in the field. There is a current trend among data center managers to link their monitoring platforms together so that they have one common central platform to view and navigate to distributed monitoring systems. We have designed our application, OpenData, with a “Monitor of Monitors” architecture in order to provide operators with a single pain of glass into both the facilities infrastructure including power-chain, cooling, and redundancies as well as IT system level information.
The key problems solved are:
- System-level metrics - Link system level IT metrics to facilities capacities
- Trouble shooting - Accelerate trouble shooting and fault dependency mapping
- Alarm management - Reduction in “noise-level” alarms
- Analytics - Building business-level metrics (BI) for capacity, efficiency, etc.
- Controls-based integrations – Improved automation based on broad data capture
Here is some more detail on each of these benefit areas …
1) System-level metrics
Typically, IT system-level metrics are collected by system management tools and will provide logical properties based on MIB-2 or the Host MIB (RFC-1514). This provides IT managers with data on the operating health of the equipment and capacity related to CPU, Disc, I/O, Memory. What management systems typically do not provide, however, is how facilities (power, cooling, etc.) impacts the cost of operations and the amount of optimal cooling.
By linking IT system-level metrics with unified facilities monitoring through a single portal, higher level business and operating metrics can be formulated to reduce the cost of operations by tuning available cooling resources to the actual needs of each server instance or other IT gear.
2) Trouble shooting
By consolidating event and performance data into a single view, you can quickly determine the cascade of failures with the visibility to determine the impacts of facility equipment. An example could be a PDU failure and what devices are in the path of the affected circuit. In redundant environments there will be a fail-over to the second PDU but in most cases the assurances of a successful hand-off are difficult to predict. By linking both facilities BMS, PDU’s, UPS, Genset with system level IT information the relationships are documented, visualized, correlated and actively monitored.
3) Reduction in rogue alarms
By linking point solutions and consolidated even level data, a complete historical view may be achieved. Through this historical view, alarm flows can be optimized and reduced operationally. An example would be a BMS received alarms at a rate where the alarms become noise as they are not easily tuned. Also contextually, it is very difficult to look at what a typical operating condition is as there is not enough or broad enough history to proactively set truly meaningful thresholds or deviations.
4) BI-based business metrics
With a single point of consolidation, you can quickly build reports and dashboards across platforms. An example would be a stock chart type view when you can visualize a period of time. This is used to determine deviations from the norm which might cause downtime or affect operational performance. With several independent systems it becomes impossible to correlate based on time or carry enough history to gain the insight necessary to prevent a potential outage.
5) Single application launch point
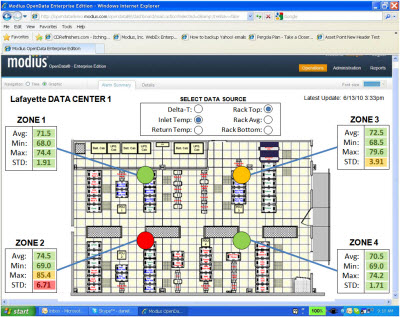
The “Monitor of Monitor” architecture brings a unified structure to gain access to operational and control systems. An example use case would be to identify cooling requirements based on broad-based data capture (e.g. an array of environmental sensors at the rack level, or real-time server-inlet temperatures taken directly from servers themselves) and then tie the resulting performance metrics into building control systems to tune VFD’s and cooling output. Integrating the BMS application directly to the monitoring system allows the use the real-time data required and feedback mechanism to optimize cooling and cost without overheating the IT equipment.
Conclusion
If you would like more detail on how Modius can help with any the above topic areas, please reach out directly using info@modius.com, and we will be happy to set up an appointment.

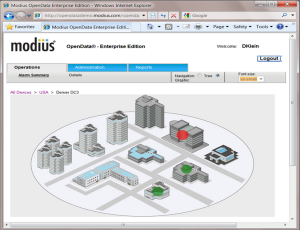 -functional instance of the Modius OpenData system that the user can manage and administer. The Graphical User Interface (GUI) allows the user to drill through to each device and identify which alarm points are being collected, how they are correlated and distributed, their polling rates, and which “real-time” alarms are critical or require immediate action. Typical customers who are signing up for a Modius vPOC are looking to replace several existing monitoring point solutions (e.g. homegrown, ALC or DataTrax). In addition, they may be looking at Modius OpenData’s “multi-site” capability to consolidate existing infrastructure monitoring across multiple locations with a single repository of easy accessed and reported information for availability, capacity, and performance utilization.