We are sometimes asked how Modius OpenData is different than a BMS. “Why should I consider Modius OpenData when I already have a BMS?”
In short, the answer comes down to using the right tool for the job. A BMS is installed at a large building to monitor and control the environment within that building, for example: lighting, ventilation, and fire systems. It helps facility managers better manage the building’s physical space and environmental conditions, including safety compliance. As concerns about energy conservation have gained critical mass, feature enhancements to BMSs have evolved to become more attuned to energy efficiency and sustainability. However, this doesn’t make a BMS a good tool for data center optimization any more than a scissors can be substituted for a scalpel.
Unlike a BMS, OpenData software by Modius was designed to uncover the true state of the data center by continually measuring all data points from all equipment, and providing the incisive decision support required to continually optimize infrastructure performance. Both facility and IT managers use OpenData to gain visibility across their data center operations, to arrive at an energy consumption baseline, and then to continually optimize the critical infrastructure of the data center—from racks to CRACs. The effectiveness of the tool used for this purpose is determined by the:
- operational intelligence enabled by the reach and granularity of data capture, accuracy of the analytics, and the extensibility of the feature set to utilize the latest data center metrics
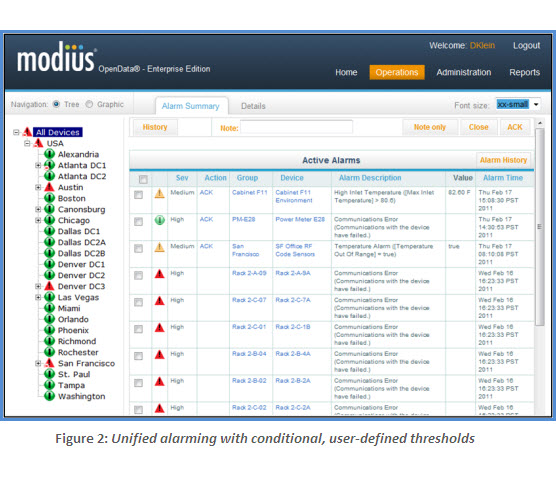
- unified alarm system to mitigate operational risk
- ease-of-use and flexibility of the tool to simplify the job
To illustrate, following are the top three differences between OpenData and a typical BMS that make OpenData the right tool to use for managing and optimizing data center performance.
- OpenData provides the operational intelligence, enabled by the reach and granularity of data capture, accuracy of the analytics, and the extensibility of the feature set, to utilize the latest data center metrics. Modius understands that data center managers don’t know what type of analysis they will need to solve a future problem. Thus, OpenData provides all data points from all devices, enabling data center managers to run any calculation and create new dashboards and reports whenever needed. This broad and granular data capture enables managers to confidently assess their XUE[1], available redundant capacity, and any other data center metric required for analysis. Moreover, because all of the data points provided can be computed at will, the latest data center metrics can be implemented at any time. In contrast, a BMS requires identifying a set of data points upon its installation. Subsequent changes to that data set require a service request (and service fee), which means that even if the data is collected in real-time, it may not be available to you when needed. Thus, the difficulty and expense of enabling the networked communications and reporting for real-time optimization from a BMS is far beyond what most would consider a “reasonable effort” to achieve.
- OpenData provides a unified alarm system to mitigate operational risk. With OpenData, end-users can easily set thresholds on any data point, on any device, and edit thresholds at any time. Alarms can be configured with multiple levels of escalation, each with a unique action. Alarms can be managed independently or in bulk, and the user interface displays different alarm states at a glance. In contrast, with a typical BMS integration the system only reports alarms native to the device—i.e., it doesn’t have access to alarms other than its own mechanical equipment. When data center managers take the extra steps to implement unified alarming (e.g., by feeding into the BMS the relay outputs or OPC server-to-server connections from the various subcomponents), they will often only get the summary alarms as a consequence of the cost charged per point and/or the expense of additional hardware modules and programming services to perform the communication integration with third-party equipment. Thus, when personnel receive an alarm, they have to turn to the console of the monitoring system that “owns” the alarming device to understand what is happening.
- Ease of use and flexibility to simplify the job. OpenData is designed to be user-driven: it is completely configurable by the end-user and no coding is required, period. Learning how to use OpenData takes approximately a day. For example, OpenData enables users to add new calculations, adjust thresholds, add and remove equipment, and even add new sites. In contrast, using a BMS to pro-actively make changes is virtually impossible to administer independently. Because the BMS is typically one component of a vendor’s total environmental control solution, the notion of “flexibility” is constrained to what is compatible with the rest of their solution offerings. Consequently, a BMS adheres to rigid programming and calculations that frequently require a specialist to implement changes to the configuration, data sets, and thresholds.
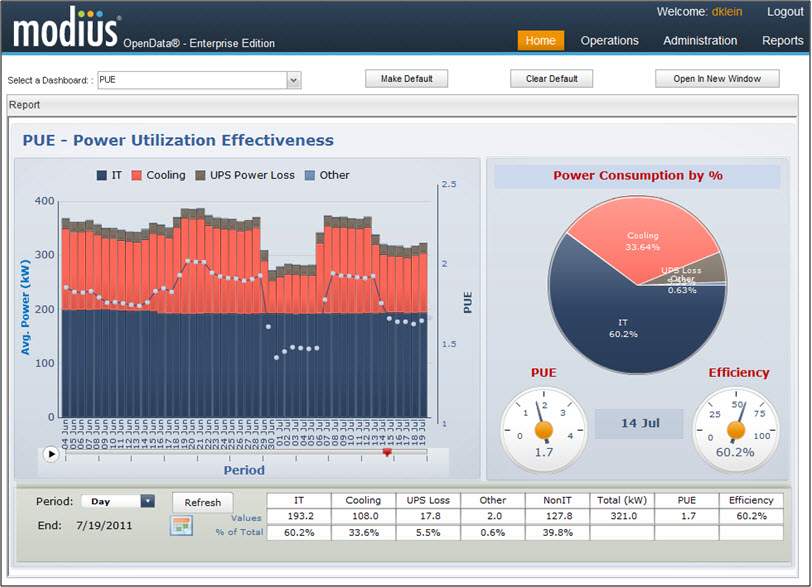
In summary, the only thing constant in data centers is flux. Getting the right information you need—when you need it—is crucial for data center up-time and optimization. For the purpose of performance monitoring and optimization, using a BMS is more problematic and ultimately more expensive because it is not designed for broad and granular data capture, analysis and user configuration. Ask yourself: What would it take to generate an accurate PUE report solely using a BMS?
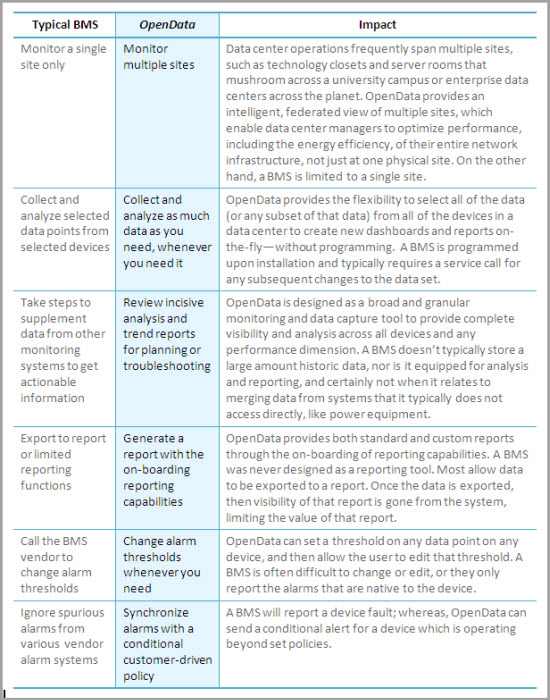
The following table summarizes key differences between OpenData and a BMS, including the impact to data center managers.
[1] The “X” refers to the usage effectiveness metric de jour, whether it is PUE, pPUE, CUE, WUE, or something new.
 Can’t measure data-center heat load, but have good electrical sub-metering. Use electrical power as a substitute for cooling load. Every watt going in ends up as heat, and there usually aren’t too many people in the space routinely. Works best if you’re also measuring the power to all other non-data-center cooled space. The ratio of the two will get you close to the ratio of their cooling loads. If there are people in a space routinely, add 1 kWh of load per head per 8-hr day of light office work.
