Modius Data Center Blog

So What Really is DCIM, anyway?

Posted by Donald Klein on Wed, May 25, 2011 @ 05:56 PM

Early last year, Gartner published a short research note that has since had an unexpectedly significant impact on the vocabulary of data center management professionals.  Prior to March 2010, which is when Dave Cappuccio published “Beyond IT,” the term ‘data center infrastructure management’ (or DCIM) was rarely ever used.  Instead, the most common terms describing software to manage power and cooling infrastructure were ‘data center monitoring’ or ‘data center asset tracking’ or ‘BMS for data center.’  We know this, because here at Modius we use an inbound analytics application to track the search terms by internet users to find our web site. 

By end of last month (April 2011), the simple search term DCIM has outpaced all of them!  Go to any web site keyword tracking service (e.g. www.hubspot.com) and see for yourself.  In April, there were over 10,000 queries for DCIM on one of the major search engines alone.  As a longtime software vendor for the enterprise, I find it hard to remember ever seeing a new title for a software category emerge so suddenly and so prominently.  Now everyone uses it.  Every week it seems there is a new vendor claiming DCIM credentials.

From our perspective here at Modius, we find this amusing, because we have been offering the same kind of functionality from our flagship software product OpenData since long before the term DCIM has been around.  Nonetheless, we know find ourselves in a maelstrom of interest as this new software label gains more buzz and credibility.  So what is exactly is DCIM? 

The graphic below is my summary of the major points from the original research note.  Note that DCIM was originally positioned as filling a gap between the major categories of IT Systems Management and Building Management or Building Automation Systems.

DCIM, IT, Facilities, Unification

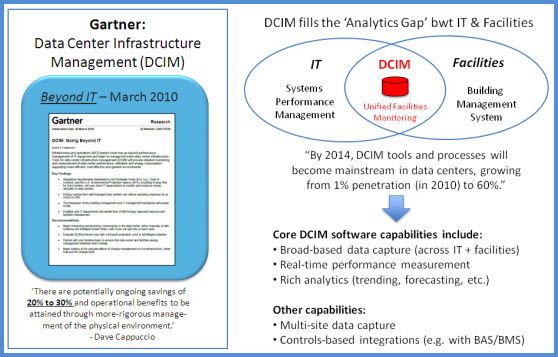
As more and more software vendors have jumped on the DCIM bandwagon, we have noticed that 4 distinct sub-categories, or segments, have emerged:

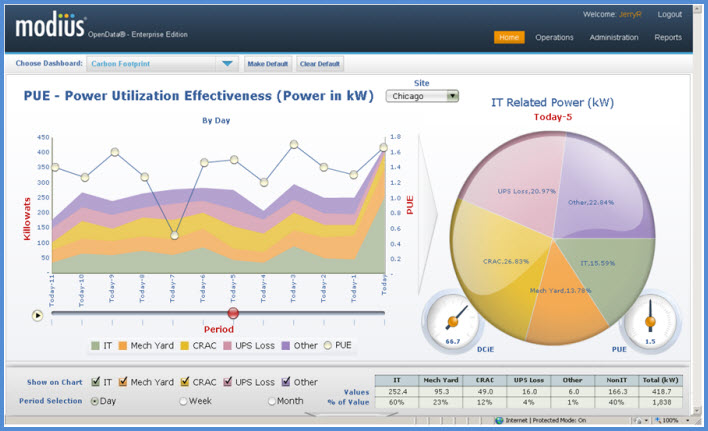
  1. Monitoring tools for centralized alarm management and real-time performance tracking of diverse types of equipment across the power and cooling chains (e.g., Modius OpenData)
  2. Calendar-based tools for tracking equipment lifecycles (i.e., particularly with respect to recording original shipment documentation, maintenance events, depreciation schedules, etc.)
  3. Workflow tools specifically designed around data center planning and change management (e.g., “If I put this server in this rack, what is the impact on my power & cooling systems?”)
  4. Tools for control and automation of cooling sub-systems (e.g., usually computer room air conditioning systems or air-handling units)

At Modius, we focus on segment #1.  We find the challenges to connecting to a diverse population of power and cooling equipment from a range of vendors is a difficult task in and of itself.  Not only are the interface challenges non-trivial (e.g., translation across multiple communication protocols), but the data storage and management problems associated with collecting this much data are also significant. 

Moreover, we are puzzled at the number of segment #3 applications which position themselves as DCIM tools, yet don’t have any real-time data capabilities of any significance.  We believe for those systems to be the most effective, they really need to leverage a monitoring tool in segment #1.

So, in conclusion--and not surprisingly--we define the DCIM software category as a collection of different types of tools for different purposes, depending on your business objectives.  But one point we like to stress to all of our customers is that we believe that real-time performance tracking is the foundation of this category, and we are looking to either build out new capabilities over time, or to partner with other software companies that are pursuing other areas of DCIM functionality.  After all, improving the performance of a facility is the ultimate end goal, and we before we do anything else, we can’t manage what we can’t measure.

Topics: Data-Collection-and-Analysis, Sensors-Meters-and-Monitoring, DCIM, monitoring, Data Center Infrastructure Management

Measuring PUE with Shared Resources, Part 2 of 2

Posted by Jay Hartley, PhD on Wed, May 25, 2011 @ 05:02 PM

PUE in an Imperfect World

Last week I started discussing the instrumentation and measurement of PUE when the data center shares resources with other facilities. The most common shared resource is chilled water, such as from a common campus or building mechanical yard. We looked at the simple way to allocate a portion of the power consumed by the mechanical equipment to the overall power consumed by the data center.

The approach there assumed perfect sub-metering of both the power and chilled water, for both the data center and the mechanical yard. Lovely situation if you have it or can afford to quickly achieve it, but not terribly common out in the hard, cold (but not always cold enough for servers) world. Thus, we must turn to estimates and approximations.

Of course, any approximations made will degrade the ability to compare PUEs across facilities--already a tricky task. The primary goal is to provide a metric to measure improvement. Here are a few scenarios that fall short of the ideal, but will give you something to work with:

  • Calculate PUE pPUECan’t measure data-center heat load, but have good electrical sub-metering. Use electrical power as a substitute for cooling load. Every watt going in ends up as heat, and there usually aren’t too many people in the space routinely. Works best if you’re also measuring the power to all other non-data-center cooled space. The ratio of the two will get you close to the ratio of their cooling loads. If there are people in a space routinely, add 1 kWh of load per head per 8-hr day of light office work.
  • Water temperature is easy, but can’t install a flow meter. Many CRAHs control their cooling power through a variable valve. Reported “Cooling Load” is actually the percentage opening of the valve. Get the valve characteristics curve from the manufacturer. Your monitoring system can then convert the cooling load to an estimated flow. Add up the flows from all CRAHs to get the total.
  • Have the head loads, but don’t know the mechanical yard’s electrical power. Use a clamp-on hand meter to take some spot measurements. From this you can calculate a Coefficient of Performance (COP) for the mechanical yard, i.e., the power consumed per cooling power delivered. Try to measure it at a couple of different load levels, as the real COP will depend on the % load.
  • I’ve got no information about the mechanical yard. Not true. The control system knows the overall load on the mechanical yard. It knows which pumps are on, how many compressor stages are operating, and whether the cooling-tower fan is running. If you have variable-speed drives, it knows what speed they’re running. You should be able to get from the manufacturer at least a nominal COP curve for the tower and chiller and nominal power curves for pumps and fans. Somebody had all these numbers when they designed the system, after all.

Whatever number you come up with, perform a sanity check against the DOE’s DCPro online tool. Are you in the ballpark? Heads up, DCPro will ask you many questions about your facility that you may or may not be prepared to answer. For that reason alone, it’s an excellent exercise.

It’s interesting to note that even the Perfect World of absolute instrumentation can expose some unexpected inter-dependencies. Since the efficiency of the mechanical yard depends on its overall load level, the value of the data-center PUE can be affected by the load level in the rest of the facility. During off hours, when the overall load drops in the office space, the data center will have a larger share of the chilled-water resource. The chiller and/or cooling-tower efficiency will decline at the same time. The resulting increase in instantaneous data center PUE does not reflect a sudden problem in the data center’s operations; though it might suggest overall efficiency improvements in the control strategy.

PUE is a very simple metric, just a ratio of two power measurements, but depending on your specific facility configuration and level of instrumentation, it can be remarkably tricky to “get it right.” Thus, the ever-expanding array of tier levels and partial alternative measurements. Relatively small incremental investments can steadily improve the quality of your estimates. When reporting to management, don’t hide the fact that you are providing an estimated value. You’ll only buy yourself more grief later when the reported PUE changes significantly due to an improvement in the calculation itself, instead of any real operational changes.

The trade-off in coming to a reasonable overall PUE is between investing in instrumentation and investing in a bit of research about your equipment and the associated estimation calculations. In either case, studying the resulting number as it varies over the hours, days, and seasons can provide excellent insight into the operational behavior of your data center.

Topics: BMS, Dr-Jay, PUE, instrumentation, Measurements-Metrics, pPUE

Measuring PUE with Shared Resources, Part 1 of 2

Posted by Jay Hartley, PhD on Wed, May 18, 2011 @ 09:02 AM

Last week I wrote a little about measuring the total power in a data center, when all facility infrastructure are dedicated to supporting the data center. Another common situation is a data center in a mixed environment, such as a corporate campus or an office tower, at which the facility resources are shared. The most common shared resource is the chilled-water system, often referred to as the “mechanical yard.” As difficult as it sometimes can be to set up continuous power monitoring for a stand-alone data center, it is considerably trickier when the mechanical yard is shared. Again, simple in principle, but often surprisingly painful in practice.

Mixed Use Facility

One way to address this problem is to use The Green Grid’s partial PUE, or pPUE. While the number should not be used as a comparison against other data centers, it provides a metric to use for tracking improvements within the data center.

This isn’t always a satisfactory approach, however. Given that there is a mechanical yard, it’s pretty much guaranteed to be a major component of the overall non-IT power overhead. Using a partial PUE (pPUE) of the remaining system and not measuring, or at least estimating, the mechanical yard’s contribution masks both the overall impact of the data center and the impact of any efficiency improvements you make.

There are a number of ways to incorporate the mechanical yard in the PUE calculations. Full instrumentation is always nice to have, but most of us have to fall back on approximations. Fundamentally, you want to know how much energy the mechanical yard consumes and what portion of the cooling load is allocated to the data center.

Data Center Mechanical Plant

The Perfect World

In an ideal situation, you have the mechanical yard’s power continuously sub-metered—chillers, cooling towers, and all associated pumps and fans. Not unusual to have a single distribution point where measurement can be made. Perhaps even a dedicated ATS. Then for the ideal solution, all you need is sub-metering of the chilled-water going into the data center.

The heat load, h, of any fluid cooling system can be calculated from the temperature change, ∆T, and the overall flow rate, qh=Cq∆T, where C is a constant that depends on the type of fluid and the units used. As much as I dislike non-metric units, it is easy to remember that C=500 when temperature is in °F and flow rate is in gal/min, giving heat load in BTU/h. (Please don’t tell my physics instructors I used BTUs in public.) Regardless of units, the total power to allocate to your data center overhead is Pdc=Pmech (hdc⁄hmech). Since what matters is the ratio, the constant C cancels out and you have Pdc=Pmech (q∆Tdcq∆Tmech ).

You’re pretty much guaranteed to have the overall temperature and flow data for the main chilled-water loop in the BMS system already, so you have q∆Tmech. Much less likely to have the same data for just the pipes going in and out of your data center. If you do, hurrah, you’re in The Perfect World, and you’re probably already monitoring your full PUE and didn’t need to read this article at all.

Perfect and You Don’t Even Know It

Don’t forget to check the information from your floor-level cooling equipment as well. Some of them do measure and report their own chilled-water statistics, in which case no additional instrumentation is needed. In the interest of brand neutrality, I won’t go into specific names and models in this article, but feel free to contact me with questions about the information available from different equipment.

Perfect Retrofit

If you’re not already sub-metered, but you have access to a straight stretch of pipe at least a couple feet long, then consider installing an ultrasonic flow meter. You’ll need to strap a transmitter and a receiver to the pipe, under the insulation, typically at least a foot apart along the pipe. No need to stop the flow or interrupt operation in any way. Either inflow or outflow is fine. If they’re not the same, get a mop; you have other more pressing problems. Focus on leak detection, not energy monitoring.

If the pipe is metal, then place surface temperature sensors directly on the outside of the inflow and outflow pipes, and insulate them well from the outside air. Might not be the exact same temperature as the water, but you can get very close, and you’re really most concerned about the temperature difference anyway. For non-metal pipes, you will have to insert probes into the water flow. You might have available access ports, if you’re lucky.

The Rest of Us

Next week I’ll discuss some of the options available for the large population of data centers that don’t have perfect instrumentation, and can’t afford the time and/or money to purchase and install it right now.

Topics: BMS, Dr-Jay, PUE, instrumentation, Measurements-Metrics, pPUE

Monitoring Total Energy for PUE

Posted by Jay Hartley, PhD on Mon, May 09, 2011 @ 02:34 PM

I am routinely surprised at how difficult it can be to determine the total energy consumption for many data centers. Stand-alone data centers can at least look at the monthly bill from the utility, but as the Green Grid points out when discussing PUE metrics, continuous monitoring is preferred whenever possible. Measurement in an environment where resources, such as chilled water, are shared with non-data center facilities can be even more complex. I’ll discuss that topic in the coming weeks. For now, I want to look just at the stand-alone data center.

PUE, Dashboard, Monitoring

In general, the choices are pretty simple for a green-field installation. The only real requirement is commitment to buying the instrumentation. Solid-core CTs are cheaper, and generally smaller for the same current range. Wiring in the voltage is easy. Retrofits are more interesting. Nobody likes to work on a hot electrical system, but shutting down a main power feed is a risky process, even with redundant systems.

One logical metering point is the output of the main transfer switches. Many folk assume they already have power metering on their ATS. It has an LCD panel showing various electrical readings, after all. Unfortunately, more often than not, only voltage is measured. That’s all the switch needs to do its job. Seems that the advanced metering option is either overlooked or the first thing to go when trimming the budget.

Retrofitting the advanced option into an ATS is not trivial. Clamping on a few CTs might not seem tough, but the metering module itself generally has to be completely swapped out. Full shut-down time.

A separate revenue-grade power meter is not terribly expensive these days. In some cases it may even be competitive with the advanced metering option from your ATS manufacturer. Meters that include power-quality metrics such as THD can be found for less than $3K, CTs included. Such a meter could be installed directly on the output of the ATS, but the input of the main distribution panel is generally a better option.

Clamping on the CTs is relatively straightforward, even on a live system, though it can be tricky if the cabling is wired too tightly. Slim, flexible Rogowski coils are an excellent option in this case. A bit pricier, but ease of installation can make back the difference in labor pretty quickly.

For voltage sensing, distribution panels often have spare output terminals available. This is ideal in a retrofit situation, and desirable even in a new install. Odds are the breaker rating is higher than the meter could handle, so don’t forget to include protection fusing. If no spare circuit is available, you can perhaps find one that is at least non-critical, such as a lighting circuit, and could be shut down long enough to tie in the voltage.

Worst-case retrofit scenario, you have no local voltage connections available. CTs alone are better than nothing. A good monitoring system can combine those readings with nominal voltages, or voltages from the ATS, to provide at least apparent power. Most meters can be powered from a single-phase voltage supply, even 110V wall power. I recommend springing for the full power meter even in this case. At some point you’ll likely have some down time, hopefully scheduled, on this circuit, and you can perform the full proper wiring at that time.

The final decision about your meter is whether to get the display. If your goal is continuous measurement (i.e., monitoring), the meter should be communicating with a monitoring system. The LED or LCD display will at best provide you a secondary check on the readings. The option also complicates the installation, because you need some kind of panel mounting to hold it and make it visible. It can become more of a space issue than one might expect for a 25-sq. inch display. Avoiding the full display output saves on the cost of the meter, and saves even more on the installation labor.

Look for a meter with simple LEDs or some other indicator to help identify wiring problems like mis-matched current and voltage phases. If the meter is a transducer only, have the monitoring system up and running, and communication wiring run, before installing the meter, so you can use its readings to troubleshoot the wiring. Nobody wants to open that panel twice!

Continuous monitoring of total power is critical to managing the capacity and efficiency of a data center. Whether your concern is PUE, carbon footprint, or simply reducing the energy bill, the monthly report from the utility won’t always provide the information you need to identify specific opportunities for improvement. Even smart meters might not be granular enough to identify short-term surges, and won’t allow you to correlate the data with that from other equipment in your facility. It’s hard to justify skimping on one or two meters for a new data center. Even in a retrofit situation, consider a dedicated meter as an early step in your efficiency efforts.

Topics: Energy Efficiency, Dr-Jay, PUE, data center energy monitoring, monitoring

The Water Cooler as a Critical Facility Infrastructure

Posted by Jay Hartley, PhD on Mon, May 02, 2011 @ 04:31 PM

Any data center manager can rattle off the standard list of critical facility equipment in the data center: generator, transfer switch, UPS, PDU, CRAC, fire system, etc. At times, however, one must take a step back and broaden one's view when determining what is critical. Unfortunately, too often we don't realize we're missing something important until after disaster strikes. In the hopes of heading off some future disasters, I share with you the following cautionary tale. I'll give you the take-away message in advance: "Look up!"

Scene:  A corporate office tower in Anytown, USA. A data center consumes the bulk of one floor. It is an efficient, well-maintained data center, with dual, dedicated utility feeds supplying a 2N-redundant power system, backup generator, and redundant chillers. It also boasts a years-long history of non-stop 100% reliable operation.

Blog   Water Cooler
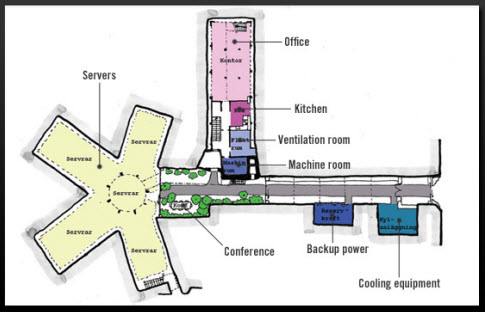
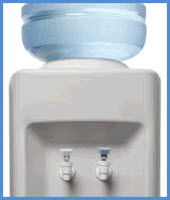
The office floors above the data center all have essentially identical layouts, consisting of conference rooms, cube farms, and the occasional honest-to-goodness office.  Centrally located on each floor is an efficient, well-maintained kitchenette. In each kitchenette is a water cooler. Like many of its kind where the tap water is potable, this water cooler is plumbed directly to the sink. The ¼-inch white plastic tubing is anchored in place with small brass ferrules. This system has been doing yeoman's work for years, reliably delivering chilled, filtered drinking water to the employees with better than 99% up time, allowing for scheduled maintenance.

Action:  Disaster strikes, in accordance with Murphy's Law, late one weekend night. The water cooler’s plastic plumbing finally succumbs to age and stress. Water streams onto the floor unchecked, quickly covering the linoleum surface and finding its way into the wall. There it heads in water's favorite direction, down, passing easily through the matching kitchenette walls in the identical floor plans below.

The water continues until reaching a floor with a dramatically different layout. Temporarily stopped in its pursuit of gravity, the water gathers its forces, soaking into the obstruction until eventually, like the plastic tube, the ceiling tile succumbs. The next obstruction happens to be a PDU and a couple of neighboring server racks in the data center. They too succumb, we assume rather spectacularly.

Data Center Water Leak
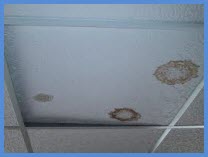
Meanwhile, back in the kitchenette, the leak is discovered during a security sweep and the flow is cut off, but human intervention has come too late for the electronics down below. Power redundancy saved all servers that were not directly water-damaged, so only a few internal business applications took an uptime hit, along with the kitchenette. Over $100,000 of damage, thanks to the failure of a few pennies of plastic tubing in a “non-critical” part of the facility.


Solution:  One could easily focus on the data center itself and protecting its equipment:  Place catch basins in the ceiling and extend the raised-floor leak detection system into them. That would help, and perhaps give a bit more warning. Not a bad idea in any case, if you have the time and money. Better solution? Inexpensive, off-the-shelf, floor leak detectors come in kits with automatic shut-off valves. Available online or in your local hardware store for home use in laundry rooms. An audible alarm is nice, but does an alarm make a noise if no one is there to hear it? Definitely get one with a second, normally-closed contact closure to link into your monitoring system. (You do have one, don’t you? Consider OpenData ME, SE, or EE!) Stop the leak early, and get advanced notice.

While you're at it, pick one up for that efficient, well-maintained, and oh-so-convenient second-floor laundry room in your home!

I hope you've enjoyed this tale. In the coming weeks, I'll share additional stories from the field as well as my musings on monitoring, instrumentation, and metrics. Visit my blog next week for insights on metering total energy for PUE—and a tip shared about the ATS.

Topics: Data-Center-Best-Practices, critical facility, leak detection, Dr-Jay, Data-Collection-and-Analysis, Sensors-Meters-and-Monitoring, Uptime-Assurance, monitoring

Getting the Most of Data Center Modularization: Optimizing in Near Real-Time

Posted by Marina Thiry on Sun, May 01, 2011 @ 05:31 PM

The challenge with data center capacity management lies not in what to do, but how to do it in a dynamic and complex environment. Traditional data centers typically were housed in one giant room with a single, integrated power and cooling system to service the entire room. This meant the energy expended to cool the room was fairly constant regardless of the actual IT load. Today’s modularized data center architecture is more energy efficient. It is designed to scale with the deployment volume of IT equipment. As IT equipment and computational workloads fluctuate with business demand, so too should the power and cooling of the data center.

Modularization helps the data center’s power and cooling systems run truly proportional to the computational demand and, thus, is less wasteful. By optimizing infrastructure performance, more servers can be supported in the data center with the same power and cooling. To fully appreciate its impact on capacity gains, first consider the how the principles of modularization can be applied throughout the entire facility:

Modular Design Data Center
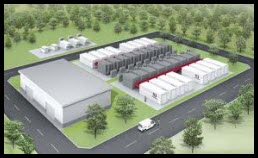
Physical Layout – Just as one manages power usage in a home by turning out the lights in unoccupied rooms, one can also manage data center power. By compartmentalizing the data center into energy zones or modules, with independent controls for power, cooling, and humidity, each module can be independently “lit up” as needed. Modularization can be achieved by erecting walls, hanging containment curtains, or by using pods, i.e., enclosed compartments of IT racks that employ a centralized environmental management system to provide cool air at intake and keep warm air at the exhaust.

IT Systems Architecture – IT infrastructure can be modularized, and should be done in conjunction with IT staff and end-user customers (business units) who own the applications deployed on servers. IT modularization involves grouping together servers, storage, and networking equipment that can be logically deployed in the same module. For example, when business computational demand is low, all corporate applications—such as the corporate intranet, internal email, external Web presence, e-commerce site, ERP applications, and more—can be deployed on the same module while the other modules in the data center remain “unlit” to save energy. As the business grows, more servers can be deployed and additional modules commissioned for IT use. For instance, all corporate intranet applications can be deployed in one module with external applications deployed in another module.

Modius AHU Optimization
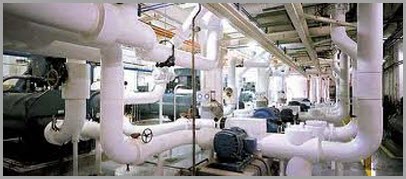
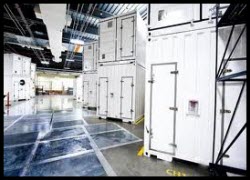
Power and Cooling Infrastructure – Right-sizing the facilities infrastructure follows the modularization of the physical layout. As the modules—zones or pods—are created
for the physical layout, the power and cooling infrastructure are deployed in corresponding units that independently service each module. Separate UPSs, PDUs and power systems, along with CRAC units, condensers, or chillers, are sized appropriately for each module. This allows the scalable expansion of the facilities infrastructure as IT equipment expands.

The principles of modularization summarized above are proven optimization strategies that can extend the life of the data center. Optimizing in near real-time delivers a higher yield from existing resources. It enables us to get more utilization out of power, cooling and space.  

If your data center infrastructure management tools fall short enabling continuous optimization, then let us show you how OpenData can help in this 20-minute Modius OpenData webcast: http://info.modius.com/data-center-monitoring-webcast-demo-by-modius

Topics: Data-Center-Best-Practices, Capacity, Efficiency, monitoring, optimization, Modularization, Capacity-Management

Latest Modius Posts

Posts by category

Subscribe via E-mail