Modius Data Center Blog

Uncovering the True State of Your Data Center with Standard Edition

Posted by Marina Thiry on Tue, Feb 22, 2011 @ 07:24 PM

How to achieve better visibility and control over your data center operations—without the risk.

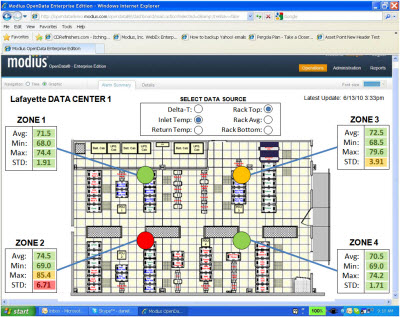
Veterans of data center operations tell us that having visibility and gaining better control over the critical infrastructure and IT assets throughout their entire facility is the key to maximizing data center efficiency. 

Achieving this requisite visibility is not a trivial task. It involves overcoming the interoperability hurdles of monitoring all of the various critical systems—such as generators, chillers, water pumps, air exchangers, PDUs, power strips, on-board server instrumentation, and more.

Data Center Monitoring Alarming Standard EditionOn top of that, making sense of the various alarm schemas—which are so vital to maintaining control of data center performance and achieving a higher level of efficiency—can be more of a headache than the alarm system is worth.  They typically don’t factor input from the full gamut of facility and IT equipment into their respective alarm thresholds. Consequently, spurious alerts from the disparate alarm systems trip over themselves and conceal the true state of the data center.

If your work is impeded by spurious alarms…or if you find yourself ignoring low-level alarms because they’re out of context from your overarching data center priorities…or if you cringe at the thought of the time and cost involved in deploying a monitoring and alarm management solution across your entire data center, then Modius can help.

data center alarms monitoring management standard editionModius offers OpenData Standard Edition, a low-cost unified alarm management and notification solution for monitoring all power and cooling equipment, including IT racks. At only $1,995 per user per year, it is the only solution in the industry offered at a very low cost and distributed as a downloadable, easy-to-install software package. This low-cost offering reduces the risk of “locking in” to a solution without having it thoroughly tested in your environment, on your own terms.

OpenData interoperates with most network equipment through its support of the essential communications protocols, including SNMP, Modbus and BACnet. It collects and stores performance data, normalizes it, then transforms the data into a simplified, federated view. This means you don’t have to kludge together various point solutions, or contend with different data formats or increments that add complexity to data center management.

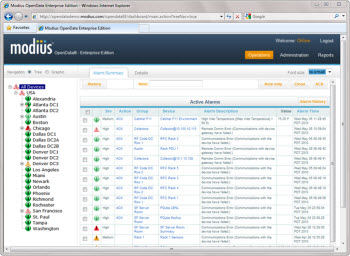
And, because of OpenData’s intelligent monitoring capabilities, customers also benefit from a sensible, unified approach to alarm management. The OpenData software matches all monitored performance against configurable thresholds and sends out alarms via a centralized notification engine. Rather than send an overflow of low-level alerts, it only sends the alarms you need when they matter most. This means you can manage your data center as a complete system—instead of disparate components—and get insight to the true state of your data center.

Sign up for a free demo of OpenData Standard Edition today and uncover the true state of your data center in a matter of hours.

Topics: data center monitoring, data center availability, data center alarming, modbus, data center infrastructure, Operational-Intelligence, Making-Data-Relevant

What You Really, Really Need: The Mother of all Data Center Monitors!

Posted by Donald Klein on Tue, Aug 31, 2010 @ 11:26 AM

You may have asked yourself, “Why do I need another monitoring and reporting product if I already have five?”  True, you most likely don’t need another monitoring product, but rather what you really, really need is a system to link these systems together. 

Why?  Because several different monitoring systems operating in their own silos doesn’t help you improve your business.  Instead, what you need to do is build business logic for optimization and capacity expansion strategies, as well as decrease the time spent to repair problems. 

To do this effectively, you need a super system: what we call the “mother of all monitors”.  This is a system that cannot only collect a superset of monitoring data from different point solutions, but also connect directly to other devices that may not currently be monitored (e.g. generators, transfer switches, breaker panels, etc.).  And it needs to do this with the kind of scalability, analytics, and ability to integrate with other management systems that you would expect from an enterprise-class tool. 

Here at Modius, we are already seeing this happen in the field.  There is a current trend among data center managers to link their monitoring platforms together so that they have one common central platform to view and navigate to distributed monitoring systems.  We have designed our application, OpenData, with a  “Monitor of Monitors” architecture in order to provide operators with a single pain of glass into both the facilities infrastructure including power-chain, cooling, and redundancies as well as IT system level information.

MOM2

The key problems solved are:

  1.  System-level metrics - Link system level IT metrics to facilities capacities  
  2.  Trouble shooting - Accelerate trouble shooting and fault dependency mapping
  3. Alarm management - Reduction in “noise-level” alarms
  4. Analytics - Building business-level metrics (BI) for capacity, efficiency, etc.
  5. Controls-based integrations – Improved automation based on broad data capture

Here is some more detail on each of these benefit areas …

1)      System-level metrics

Typically, IT system-level metrics are collected by system management tools and will provide logical properties based on MIB-2 or the Host MIB (RFC-1514).  This provides IT managers with data on the operating health of the equipment and capacity related to CPU, Disc, I/O, Memory.  What management systems typically do not provide, however, is how facilities (power, cooling, etc.) impacts the cost of operations and the amount of optimal cooling. 

By linking IT system-level metrics with unified facilities monitoring through a single portal, higher level business and operating metrics can be formulated to reduce the cost of operations by tuning available cooling resources to the actual needs of each server instance or other IT gear.

2)      Trouble shooting

By consolidating event and performance data into a single view, you can quickly determine the cascade of failures with the visibility to determine the impacts of facility equipment.  An example could be a PDU failure and what devices are in the path of the affected circuit.  In redundant environments there will be a fail-over to the second PDU but in most cases the assurances of a successful hand-off are difficult to predict.  By linking both facilities BMS, PDU’s, UPS, Genset with system level IT information the relationships are documented, visualized, correlated and actively monitored.

3)      Reduction in rogue alarms

By linking point solutions and consolidated even level data, a complete historical view may be achieved.  Through this historical view, alarm flows can be optimized and reduced operationally.  An example would be a BMS received alarms at a rate where the alarms become noise as they are not easily tuned.  Also contextually, it is very difficult to look at what a typical operating condition is as there is not enough or broad enough history to proactively set truly meaningful thresholds or deviations.

4)      BI-based business metrics

With a single point of consolidation, you can quickly build reports and dashboards across platforms.  An example would be a stock chart type view when you can visualize a period of time.  This is used to determine deviations from the norm which might cause downtime or affect operational performance.  With several independent systems it becomes impossible to correlate based on time or carry enough history to gain the insight necessary to prevent a potential outage.

5)      Single application launch point

The “Monitor of Monitor” architecture brings a unified structure to gain access to operational and control systems.  An example use case would be to identify cooling requirements based on broad-based data capture (e.g. an array of environmental sensors at the rack level, or real-time server-inlet temperatures taken directly from servers themselves) and then tie the resulting performance metrics into building control systems to tune VFD’s and cooling output.  Integrating the BMS application directly to the monitoring system allows the use the real-time data required and feedback mechanism to optimize cooling and cost without overheating the IT equipment.

Conclusion

If you would like more detail on how Modius can help with any the above topic areas, please reach out directly using info@modius.com, and we will be happy to set up an appointment.

Topics: data center monitoring, Data-Collection-and-Analysis, Data Center Metrics, Data Center PUE, data center energy monitoring, real-time metrics, Data-Collection-Processing, data center alarming

An Unforeseeable Leak Finds Its Way to Sybase’s Data Center

Posted by Jay Hartley on Wed, Sep 09, 2009 @ 07:00 AM

As a follow-up to our inaugural blog post regarding our implementation of continuous PUE monitoring at Sybase,  I wanted to share a real-world challenge Sybase recently encountered. Although Sybase is acknowledged as one of the country’s most efficient, reliable data centers, it is not without its unexpected challenges.

This spring, Sybase narrowly avoided a significant outage due to an unforeseen water leak from outside the walls of its data center. On each floor, directly above its high-availability Secure Data Center facility, are several kitchenettes (for the offices on that particular floor). On a recent weekend, a water hose popped in one of the kitchenettes connecting the sink to a cooler. Water gushed out and quickly flooded the kitchen. Worse, it eventually found its way down two stories between the walls to the data center facility below.


Sybase did not learn about the problem until one its PDUs was shut down by the leak. Luckily, its PDU redundancy avoided any outage. However, this unforeseeable leak resulted in a damaged PDU and a few downed servers.

To avoid an event such as this happening in the future, Sybase turned to Modius. Modius identified a cost-effective leak detection system to be installed in each of the kitchenettes in the building. We configured these residential-scale leak controller systems on the Modius Device Gateway and added it to the notification schema, demonstrating the versatility of our OpenData® system to capture data from practically any device used inside or outside a data center.

By utilizing one of the existing Modius I/O modules, we were able to configure and test the entire system in about 2.5 hours, providing Sybase a quick, cost-effective means to avoid an event such as this in the future.

Kind regards,
Jay H. Hartley, PhD
Director of Professional ServicesJay.Hartley[at]Modius.com

Topics: data center monitoring, data center availability, data center alarming

Latest Modius Posts

Posts by category

Subscribe via E-mail