Modius Data Center Blog

Data Center Optimization Roadmap

Posted by Marina Thiry on Thu, Jun 02, 2011 @ 01:29 PM

Speaking to a standing-room-only audience at the 2011 Uptime Symposium, Modius CEO Craig Compiano talked about the evolution of data center maturity: keeping pace with business needs. He introduced Modius’ Data Center Optimization Roadmap, which illustrates how optimization capabilities can be logically divided and accomplished in incremental steps. These steps deliver tangible benefits that continue to be leveraged as data center capabilities mature and become more relevant to the enterprise it supports.

Data Center, Optimization

The value of this roadmap immediately resonates with anyone who has worked on a long-term IT project—like managing a data center, for instance. All too often failures occur because the project team did not have the foresight to discern how their technology implementation might evolve over time. Consequently, early investments become outmoded in about 18 months, and the stakeholders are confronted with rapidly diminishing returns on their investment, if they are ever fully realized at all.

Instead of thinking about adding functionality and capacity in terms of incremental hardware (e.g., adding more servers), consider maximizing the capacity of your current investment, such that resources are more economically utilized within the existing infrastructure (e.g., identifying stranded capacity). Let’s take a closer look at the Data Center Optimization Roadmap to see how this can be accomplished.

describe the image

Click Image to Zoom

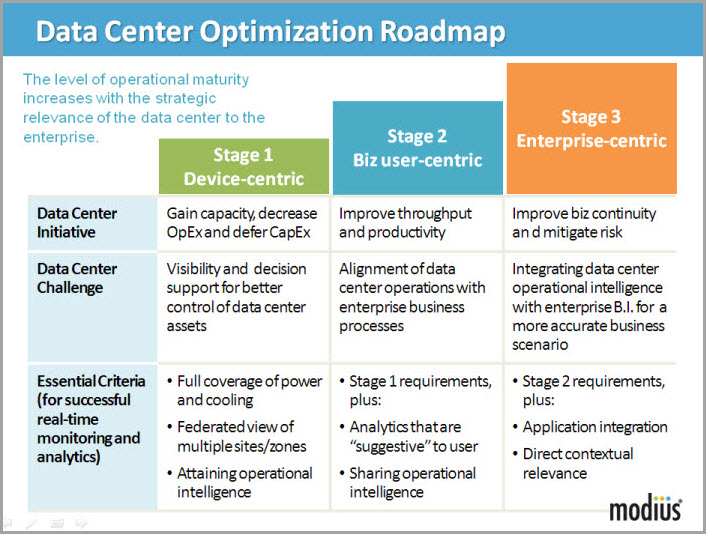
Modius sees the operational maturity of the data center in three stages. At each stage, the operational maturity of the data center increases with the level of strategic relevance it provides to the enterprise.

Stage 1 is device-centric: Continuous optimization requires gaining visibility of data center assets—from racks to CRACs—including those assets at different sites. Whether assets are being monitored from across the hall or across the continent, granular visibility into each device is necessary to understand how resources are being utilized by themselves and within the larger system that is the network.

The only way to accomplish this is by measuring where, when, and at what rate power is being consumed. Device-level visibility enables us to eke every kW of power, to maintain safe yet miserly cooling levels, and to ensure every square foot of the data center floor is effectively being used. (Walking around the data center floor and spot checking metered readings is no longer effective.)

With this device-level insight, you can identify tactical ways of maximizing utilization or reducing energy consumption. And, as a result of more efficient use of resources, businesses can defer capital expenses.

Stage 2 is business user-centric: The second stage in advancing data center optimization requires the alignment of data center performance information with the business user’s requirements. (By business users, we mean either internal users, such as a department or a cost center at an enterprise, or external users, such as the customers at a co-lo facility.) This level of optimization can only be achieved once the mechanisms are in place to ensure visibility of data center assets by their end users, per Stage 1. For example, monitoring and decision support tools must have the ability to logically sort and filter equipment by business groups, rather than the physical location of equipment in a data center (e.g., racks, rows or zones). Likewise, these tools must be flexible to accommodate business-driven time periods, rather than time periods convenient only to data center operations.

By enabling this business user-centric view—that is, by making data center operational intelligence meaningful to the end-users of the data center—IT and Facility personnel can now engage business users in a productive dialog about how their business requirements impact data center resources. Now, data center managers can begin to optimize throughput and productivity in a way that is meaningful to the business, which significantly advances the strategic relevance of the data center to the enterprise.

Stage 3 is enterprise-centric:  The third stage in advancing data center optimization requires making available data center operational intelligence with enterprise business intelligence (BI).  We are not suggesting anything complicated or unwieldy, only that by including data center performance and resource data, enterprises can provide a more complete picture of the true cost of doing business. By aligning “back end” data center operations with “front end” enterprise business processes, we can understand how market pressures impact the infrastructure, which in turn helps improve business continuity and mitigate risk.

For example, product and marketing managers can now have visibility into the data center resources supporting their web services. They can drill down to their back-office systems and  account for the commissioning and decommissioning servers, plus the energy and human capital required to run and manage those services. Another example: supply chain managers or sourcing managers can now see where and at what rate energy is being consumed across data center operations, enterprise-wide. This enables them to make better decisions about where to source energy, in addition to forecasting how much is needed.

These improvements are evidenced by enterprise agility—enterprises that can rapidly respond to a dynamic market and economic pressures. It is at this stage of maturity in data center operations that a data center can have a profound impact on whether a business can compete and win in the marketplace. 

describe the image Different isn't always better, but better is always different.
Marina Thiry, Director of Product Marketing

Topics: facility, Uptime Symposium, Craig Compiano, Data-Center-Best-Practices, Optimizing, DCIM, monitoring, Roadmap, optimization, infrastructure

So What Really is DCIM, anyway?

Posted by Donald Klein on Wed, May 25, 2011 @ 05:56 PM

Early last year, Gartner published a short research note that has since had an unexpectedly significant impact on the vocabulary of data center management professionals.  Prior to March 2010, which is when Dave Cappuccio published “Beyond IT,” the term ‘data center infrastructure management’ (or DCIM) was rarely ever used.  Instead, the most common terms describing software to manage power and cooling infrastructure were ‘data center monitoring’ or ‘data center asset tracking’ or ‘BMS for data center.’  We know this, because here at Modius we use an inbound analytics application to track the search terms by internet users to find our web site. 

By end of last month (April 2011), the simple search term DCIM has outpaced all of them!  Go to any web site keyword tracking service (e.g. www.hubspot.com) and see for yourself.  In April, there were over 10,000 queries for DCIM on one of the major search engines alone.  As a longtime software vendor for the enterprise, I find it hard to remember ever seeing a new title for a software category emerge so suddenly and so prominently.  Now everyone uses it.  Every week it seems there is a new vendor claiming DCIM credentials.

From our perspective here at Modius, we find this amusing, because we have been offering the same kind of functionality from our flagship software product OpenData since long before the term DCIM has been around.  Nonetheless, we know find ourselves in a maelstrom of interest as this new software label gains more buzz and credibility.  So what is exactly is DCIM? 

The graphic below is my summary of the major points from the original research note.  Note that DCIM was originally positioned as filling a gap between the major categories of IT Systems Management and Building Management or Building Automation Systems.

DCIM, IT, Facilities, Unification

As more and more software vendors have jumped on the DCIM bandwagon, we have noticed that 4 distinct sub-categories, or segments, have emerged:

  1. Monitoring tools for centralized alarm management and real-time performance tracking of diverse types of equipment across the power and cooling chains (e.g., Modius OpenData)
  2. Calendar-based tools for tracking equipment lifecycles (i.e., particularly with respect to recording original shipment documentation, maintenance events, depreciation schedules, etc.)
  3. Workflow tools specifically designed around data center planning and change management (e.g., “If I put this server in this rack, what is the impact on my power & cooling systems?”)
  4. Tools for control and automation of cooling sub-systems (e.g., usually computer room air conditioning systems or air-handling units)

At Modius, we focus on segment #1.  We find the challenges to connecting to a diverse population of power and cooling equipment from a range of vendors is a difficult task in and of itself.  Not only are the interface challenges non-trivial (e.g., translation across multiple communication protocols), but the data storage and management problems associated with collecting this much data are also significant. 

Moreover, we are puzzled at the number of segment #3 applications which position themselves as DCIM tools, yet don’t have any real-time data capabilities of any significance.  We believe for those systems to be the most effective, they really need to leverage a monitoring tool in segment #1.

So, in conclusion--and not surprisingly--we define the DCIM software category as a collection of different types of tools for different purposes, depending on your business objectives.  But one point we like to stress to all of our customers is that we believe that real-time performance tracking is the foundation of this category, and we are looking to either build out new capabilities over time, or to partner with other software companies that are pursuing other areas of DCIM functionality.  After all, improving the performance of a facility is the ultimate end goal, and we before we do anything else, we can’t manage what we can’t measure.

Topics: Data-Collection-and-Analysis, Sensors-Meters-and-Monitoring, DCIM, monitoring, Data Center Infrastructure Management

Measuring PUE with Shared Resources, Part 2 of 2

Posted by Jay Hartley, PhD on Wed, May 25, 2011 @ 05:02 PM

PUE in an Imperfect World

Last week I started discussing the instrumentation and measurement of PUE when the data center shares resources with other facilities. The most common shared resource is chilled water, such as from a common campus or building mechanical yard. We looked at the simple way to allocate a portion of the power consumed by the mechanical equipment to the overall power consumed by the data center.

The approach there assumed perfect sub-metering of both the power and chilled water, for both the data center and the mechanical yard. Lovely situation if you have it or can afford to quickly achieve it, but not terribly common out in the hard, cold (but not always cold enough for servers) world. Thus, we must turn to estimates and approximations.

Of course, any approximations made will degrade the ability to compare PUEs across facilities--already a tricky task. The primary goal is to provide a metric to measure improvement. Here are a few scenarios that fall short of the ideal, but will give you something to work with:

  • Calculate PUE pPUECan’t measure data-center heat load, but have good electrical sub-metering. Use electrical power as a substitute for cooling load. Every watt going in ends up as heat, and there usually aren’t too many people in the space routinely. Works best if you’re also measuring the power to all other non-data-center cooled space. The ratio of the two will get you close to the ratio of their cooling loads. If there are people in a space routinely, add 1 kWh of load per head per 8-hr day of light office work.
  • Water temperature is easy, but can’t install a flow meter. Many CRAHs control their cooling power through a variable valve. Reported “Cooling Load” is actually the percentage opening of the valve. Get the valve characteristics curve from the manufacturer. Your monitoring system can then convert the cooling load to an estimated flow. Add up the flows from all CRAHs to get the total.
  • Have the head loads, but don’t know the mechanical yard’s electrical power. Use a clamp-on hand meter to take some spot measurements. From this you can calculate a Coefficient of Performance (COP) for the mechanical yard, i.e., the power consumed per cooling power delivered. Try to measure it at a couple of different load levels, as the real COP will depend on the % load.
  • I’ve got no information about the mechanical yard. Not true. The control system knows the overall load on the mechanical yard. It knows which pumps are on, how many compressor stages are operating, and whether the cooling-tower fan is running. If you have variable-speed drives, it knows what speed they’re running. You should be able to get from the manufacturer at least a nominal COP curve for the tower and chiller and nominal power curves for pumps and fans. Somebody had all these numbers when they designed the system, after all.

Whatever number you come up with, perform a sanity check against the DOE’s DCPro online tool. Are you in the ballpark? Heads up, DCPro will ask you many questions about your facility that you may or may not be prepared to answer. For that reason alone, it’s an excellent exercise.

It’s interesting to note that even the Perfect World of absolute instrumentation can expose some unexpected inter-dependencies. Since the efficiency of the mechanical yard depends on its overall load level, the value of the data-center PUE can be affected by the load level in the rest of the facility. During off hours, when the overall load drops in the office space, the data center will have a larger share of the chilled-water resource. The chiller and/or cooling-tower efficiency will decline at the same time. The resulting increase in instantaneous data center PUE does not reflect a sudden problem in the data center’s operations; though it might suggest overall efficiency improvements in the control strategy.

PUE is a very simple metric, just a ratio of two power measurements, but depending on your specific facility configuration and level of instrumentation, it can be remarkably tricky to “get it right.” Thus, the ever-expanding array of tier levels and partial alternative measurements. Relatively small incremental investments can steadily improve the quality of your estimates. When reporting to management, don’t hide the fact that you are providing an estimated value. You’ll only buy yourself more grief later when the reported PUE changes significantly due to an improvement in the calculation itself, instead of any real operational changes.

The trade-off in coming to a reasonable overall PUE is between investing in instrumentation and investing in a bit of research about your equipment and the associated estimation calculations. In either case, studying the resulting number as it varies over the hours, days, and seasons can provide excellent insight into the operational behavior of your data center.

Topics: BMS, Dr-Jay, PUE, instrumentation, Measurements-Metrics, pPUE

Latest Modius Posts

Posts by category

Subscribe via E-mail